In 1991 I was an intern at the IMF. Robert Flood asked what am I writing about and I said the exchange rate. He said, I advise you to look at something else because explaining the exchange rate is hopeless. That was 27 years ago and nothing has changed.
Since the Meese and Rogoff finding many decades ago that the no model's forecast could beat the forecast of the random walk model, nothing much has happened on that front.
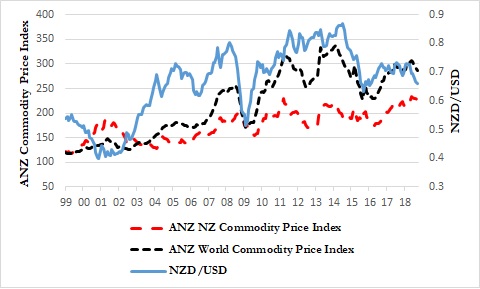
A couple of years ago I wrote a paper where I showed that commodity prices for commodity-exporting countries (New Zealand, Australia, Canada) explain their exchange rates. Here is a graph of monthly data for NZ.

The high NZD/USD and low productivity might be puzzling. However, NZ might be a small country, but it is not small when we talk about milk. It is a major player in the global milk market. The higher the demand for milk the more the demand for the NZD.
The NZD/USD has been falling in the past few weeks, which motivated me to produce some dynamic stochastic projections.I use three models: a random walk model (i.e., the NZD / USD depends on its last period value only); an unrestricted VAR with the NZD/USD, the ANZ NZ commodity price index, and the ANZ world commodity price index; and an SVAR, whereby I have PPP imposed, and PPP is basically the commodity price indexes ratio. I estimate these VARs with and without, a constant term because the constant affects the forecasts as we know (The VARs have 12 lags). The sample is Jan 1999 to Sep 2018. Then for every month from October 2018 to June 2019, I report the average projection of 10,000 iterations (I use bootstrapping to generate the innovations).

There are small differences between the models' projections. VARs with a constant term have higher projections on average. The minimum across all five models over the projection periods, is 0.6483 (Nov 2018) and the maximum is 0.6742 (Jun 2019).
I could not tell which model is better because these are out-of-sample projections. We have to wait and see if they have better information than the Random Walk.
Since the Meese and Rogoff finding many decades ago that the no model's forecast could beat the forecast of the random walk model, nothing much has happened on that front.
A couple of years ago I wrote a paper where I showed that commodity prices for commodity-exporting countries (New Zealand, Australia, Canada) explain their exchange rates. Here is a graph of monthly data for NZ.
The high NZD/USD and low productivity might be puzzling. However, NZ might be a small country, but it is not small when we talk about milk. It is a major player in the global milk market. The higher the demand for milk the more the demand for the NZD.
The NZD/USD has been falling in the past few weeks, which motivated me to produce some dynamic stochastic projections.I use three models: a random walk model (i.e., the NZD / USD depends on its last period value only); an unrestricted VAR with the NZD/USD, the ANZ NZ commodity price index, and the ANZ world commodity price index; and an SVAR, whereby I have PPP imposed, and PPP is basically the commodity price indexes ratio. I estimate these VARs with and without, a constant term because the constant affects the forecasts as we know (The VARs have 12 lags). The sample is Jan 1999 to Sep 2018. Then for every month from October 2018 to June 2019, I report the average projection of 10,000 iterations (I use bootstrapping to generate the innovations).

There are small differences between the models' projections. VARs with a constant term have higher projections on average. The minimum across all five models over the projection periods, is 0.6483 (Nov 2018) and the maximum is 0.6742 (Jun 2019).
I could not tell which model is better because these are out-of-sample projections. We have to wait and see if they have better information than the Random Walk.

